As the weeks go by, we've been making steady progress with both the paper and the data analysis. After some grid-mesh adaptions we made last week the simulations powered through the weekend to yield some interesting results for us this week. For the 11 m/s case, we refined the grid near a section where two streams were merging together. After letting that case run for a few more days, we found that the streams had separated. Whether that's due to our mesh adaption or a yet-to-be-discovered flow pattern, it is not clear.
This week we also calculated the distances between the streams for the three cases, as well as the average distance. It seems that the average distance for all the cases is between 1.32 and 1.37 cm, regardless of how many streams the case may have. In addition, we calculated the impingement area for each case as a function of time, but focusing on the small fluctuations that are observed at near-steady state. We can't say that any given case reaches exactly steady state as there are always slight changes in the area, but for all intents and purposes, these changes are so small that any deviation from the average value is negligible.
As a highlight, this week Morgan found a new way to calculate the jet impingement region thickness. The old way involved manually converting polar coordinates to Cartesian coordinates to generate a given plane. Once that plane was made, lines were created at set distances within those planes with their values plotted in order to get a select few thickness values. These lines and planes were meticulously created between and at stream locations. As thrilling as that sounds, Morgan decided to reinvent the wheel of tedious plane analysis. However, he not only reinvented the wheel, he created a Mercedes Benz Silver Lightning method of finding these thickness values. Behold! Feast your eyes upon the glory of Morgan's Method:
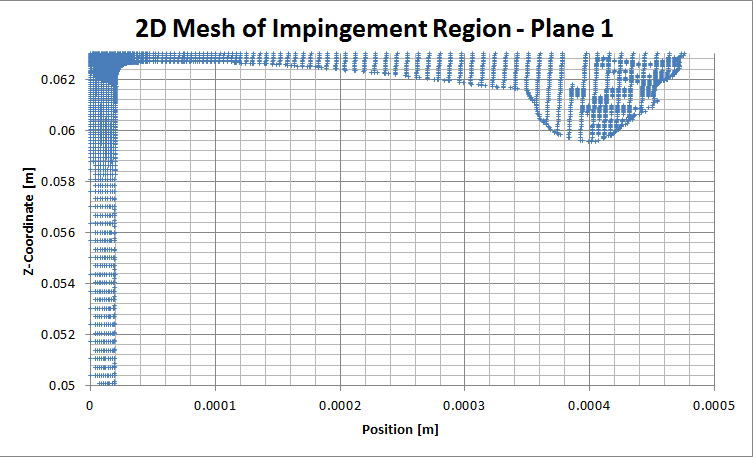 |
| This is so much more than your ordinary, every day Microsoft Excel plot. What you are seeing is a revolutionary way of doing CFD analysis. Simply scroll your mouse over a point, and it will give you a representative thickness value! (Hint: you can't actually scroll over this image to get a value, you'll have to come to our lab to have access to our Top Secret Excel documents.) |
Like any good invention, the highly-coveted secrets behind this method are patented (pending) and are reserved only for the most privileged members of the Oakland's prestigious CFD community...
No comments:
Post a Comment