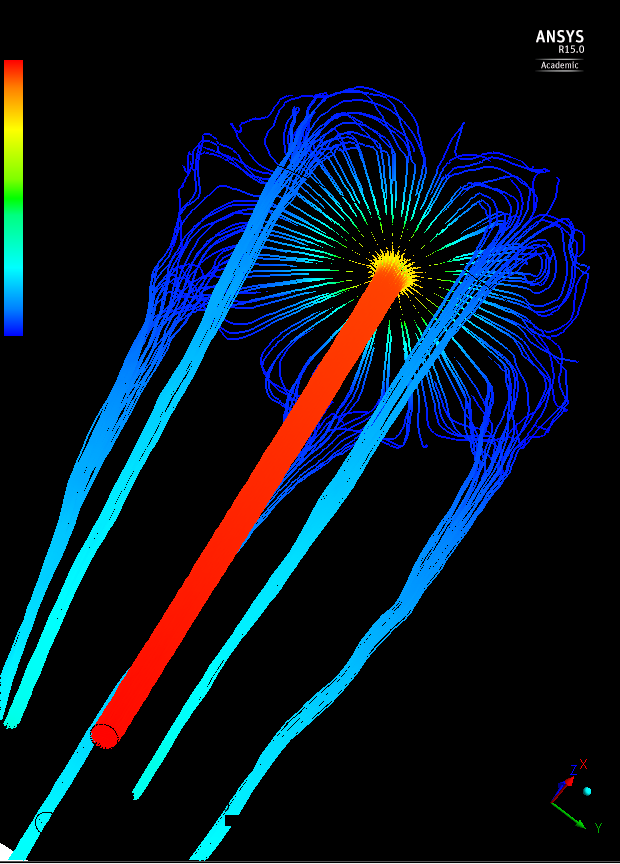
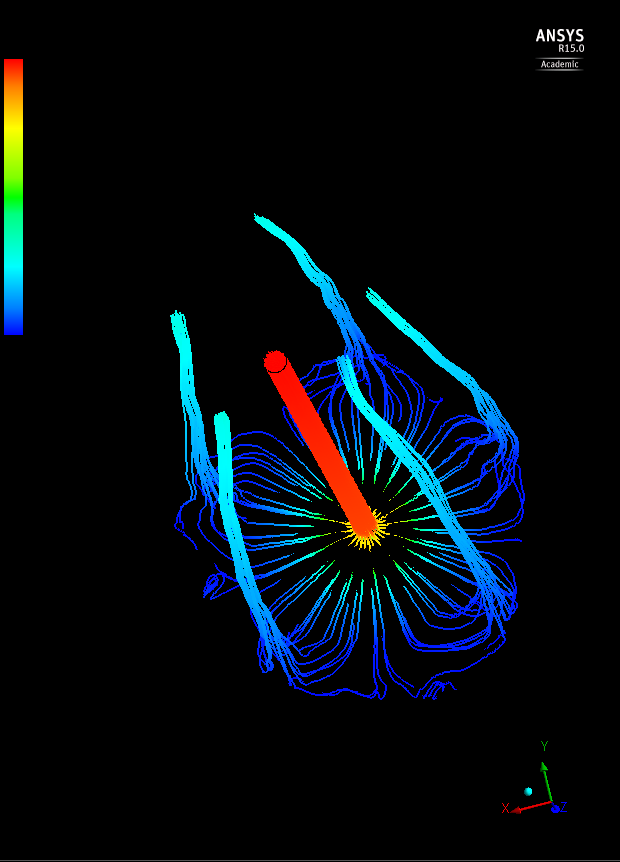
What these cool jellyfish-like pictures are showing are the streamlines of the oil at the impingement area. We can see how and where the downward streams are developing. One thing we would like to do is investigate why they are developing in a given area as well as why they are not equidistant from each other, given an equal surface tension parameter.
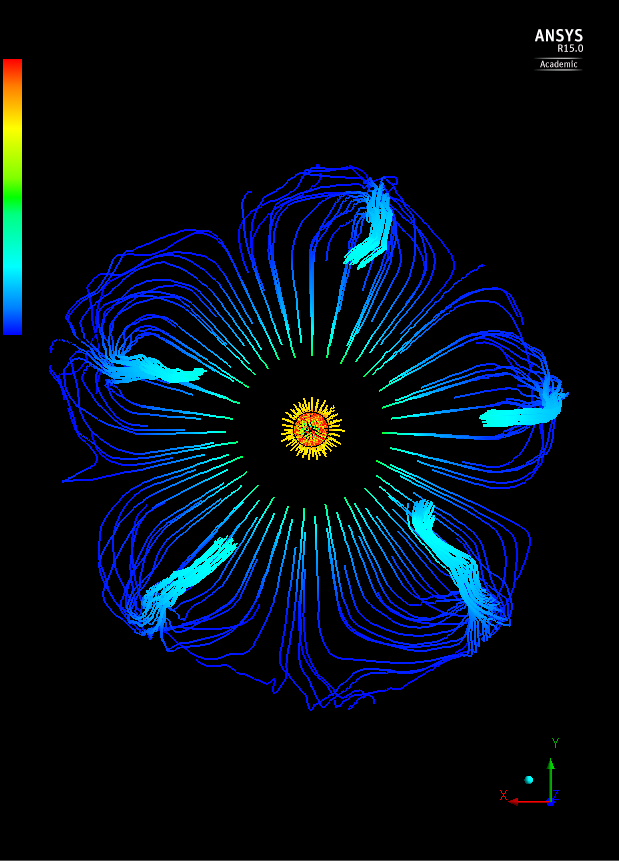
Here we have a bottom view where we can see the streamlines forming off of the impingement area. At the very bottom, we have a gathering cluster of streamlines. While most of these will inevitably find their way to the stream to the left and right, we have seen that this is where some drops of oil have fallen. With a slight increase in velocity, we believe this could be where the 6th stream is supposed to develop.
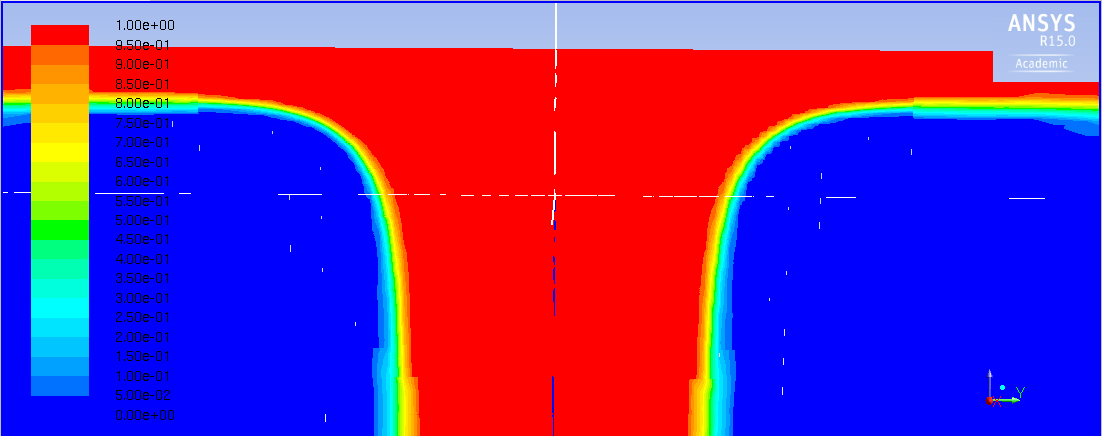
In this picture we have a side view of a section of the impingement area. We can easily estimate the thickness, however, we would like to quantify the thickness of the impingement area as a function of the radial velocity and velocity gradient.
No comments:
Post a Comment